
Your floor staff aren't the reason your margins are evaporating. You've watched them freeze during the Saturday night rush, anchored to the spot whilst the printer screams and the queue snakes out the door. It's easy to blame poor work ethic or a lack of hustle. It's also wrong. Most service failures are mechanical, not personal. A rigorous front of house workflow analysis reveals that what you recognise as human error is actually structural friction. You aren't managing people; you're operating a machine with a seized gearbox.
You've felt the frustration of high turnover yielding nothing but bloated labour costs and disgruntled guests. We're going to stop treating these symptoms with motivational fluff and start diagnosing the parasitic drag killing your bottom line. This article identifies the specific operational pressure points that trigger the Statue Effect and the hidden iPad Tax. We'll show you how to strip away the noise, reduce your reliance on individual staff energy, and protect your profit from the systemic lag that turns a busy service into a financial wreck.
Key Takeaways
- Stop blaming staff for service failures and start identifying the mechanical drag that drives up labour costs and erodes ROI.
- Understand why the Statue Effect occurs when systems redline, causing even veteran team members to freeze under pressure.
- Identify how the iPad Tax and poorly integrated tech create parasitic drag that stalls your kitchen's throughput.
- Use a data-driven front of house workflow analysis to pinpoint your thermal redline before your margins evaporate.
- Shift your focus from exhausting management effort to creating a streamlined mechanical flow that protects your bottom line.
Front of House Operational Friction: The Invisible Drag on Hospitality ROI
Operational friction is the sand in your gearbox. It is the mechanical resistance that grinds your service delivery to a halt. Most owners mistake a busy floor for a profitable one. This is a dangerous delusion. High volume often masks evaporating margins because your "busy-ness" isn't the same as throughput. Throughput is the clean, frictionless movement of a guest from arrival to departure. Friction is everything that slows that movement down.
A clinical front of house workflow analysis reveals that your staff are likely working twice as hard to achieve half the results. You see a manager sprinting between tables. You hear the screaming printer spitting out dockets like a machine gun. These aren't signs of a thriving business. They are the symptoms of a machine redlining. Manual effort is a temporary patch for broken systems. It is expensive, unsustainable, and it eventually fails.
The Gearbox Effect: Why Service Stalls Under Load
When the room fills, instructions begin to shear. In mechanical terms, shearing happens when the force applied exceeds the structural strength of the material. In a restaurant, this looks like a server forgetting a modifier or a runner missing a table number. It isn't a "people problem" or a lack of training. It is a linkage failure. Your staff's energy is a finite fuel. It cannot compensate for poor mechanical design. This falls under the broader scope of service operations management; if the linkages between the kitchen and the floor are loose, the whole machine stalls under load.
Symptoms of Systemic Lag
Systemic lag is the delay between an action and its result. One of the most common causes is the iPad Tax. This is the hidden cost of poorly integrated technology that forces staff to fight with a screen instead of engaging with a guest. Every second spent navigating a clunky interface is a second of parasitic drag. Other symptoms include:
- Re-running instructions: Asking for the same thing three times because the first two didn't stick.
- Internal friction: Arguments at the pass or amongst the team that spill over into the guest experience.
- The Statue Effect: Staff standing still whilst the world burns around them because they don't know which fire to kick first.
These lags aren't just annoying; they are expensive. They eat your ROI before you even realise there's a leak. You cannot fix a structural failure with a pep talk.
The Statue Effect: Diagnosing Why Staff Instructions Shear Under Stress
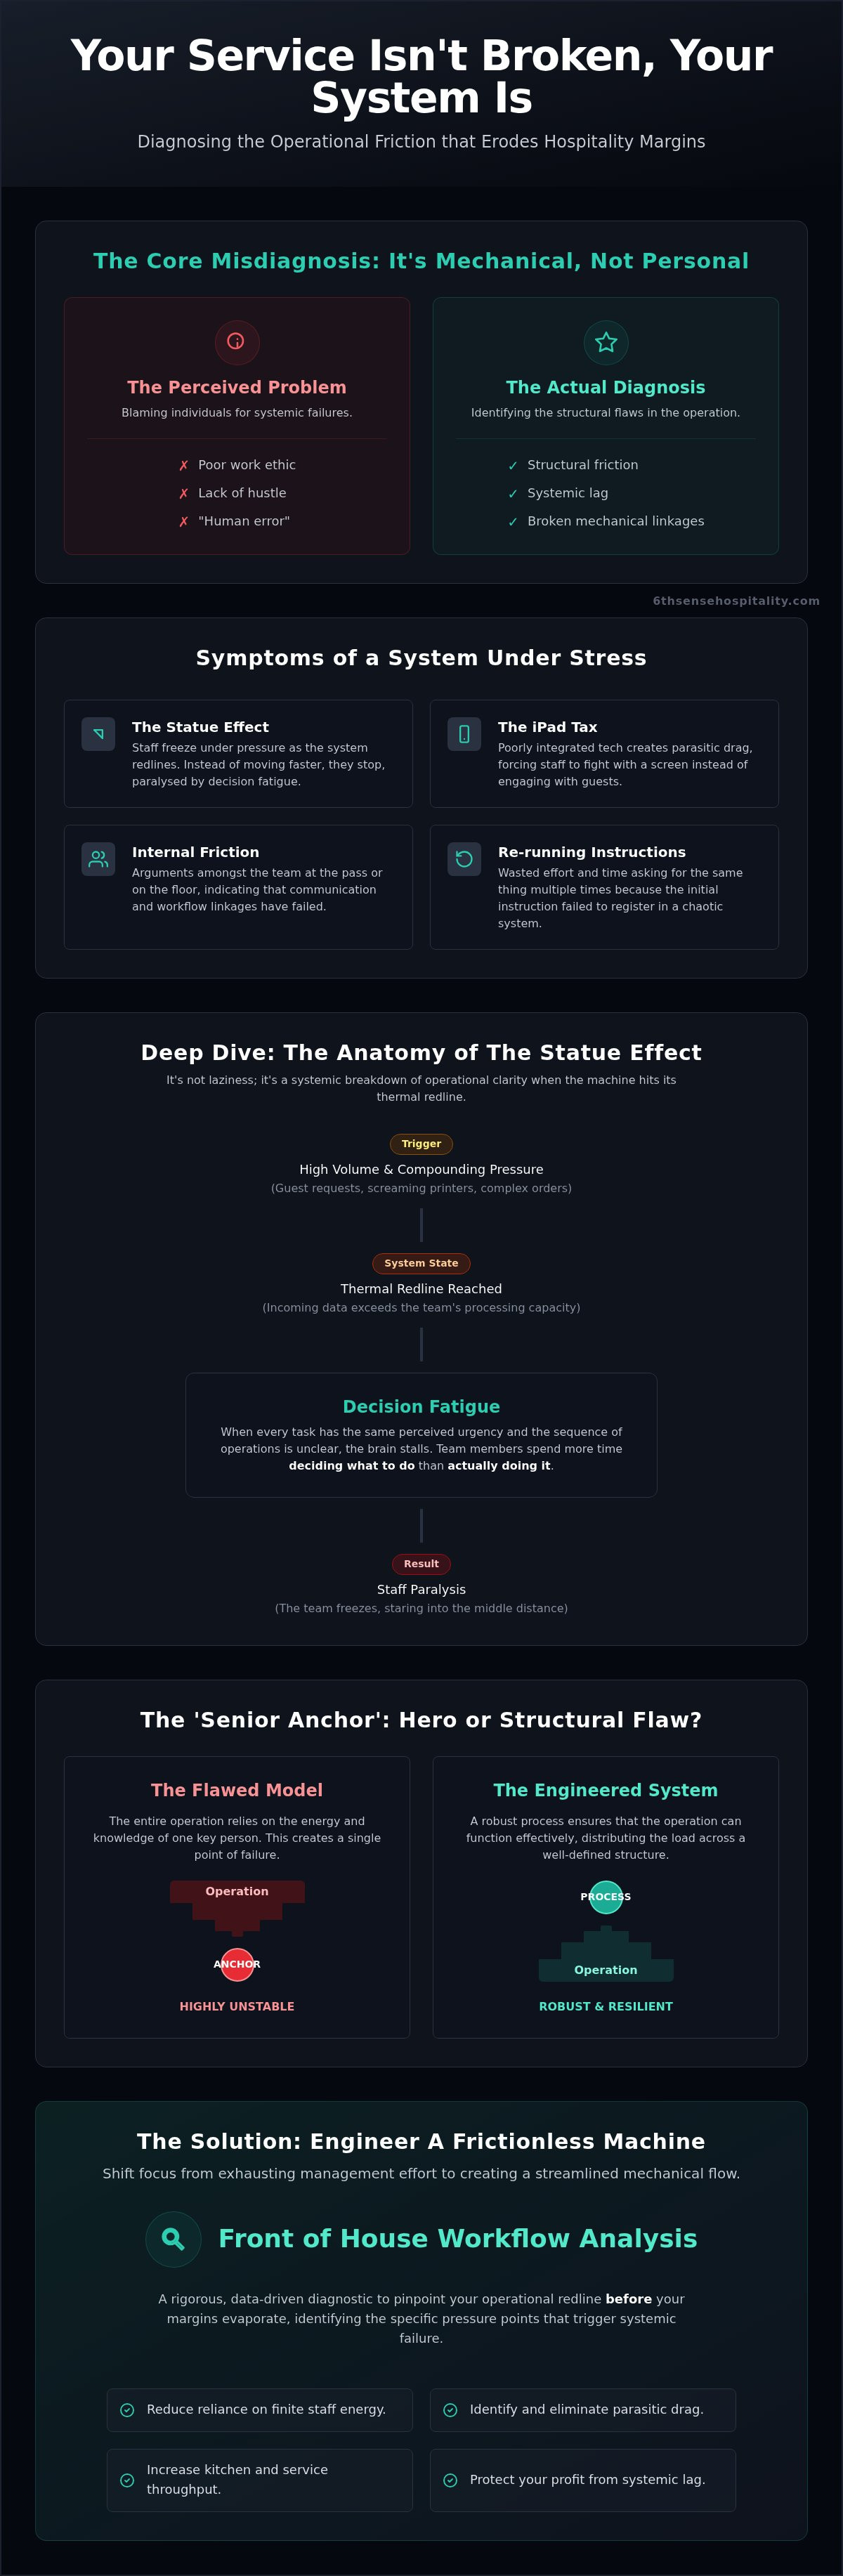
System lag isn't just a digital problem; it's a human one. When your service delivery machine hits its thermal redline, your staff don't just slow down. They stop. This is the Statue Effect. It is the moment when the volume of incoming data, orders, guest requests, and screaming printers, exceeds the team's ability to process it. Instead of moving faster, they freeze. They stand at the pass or the POS terminal, staring into the middle distance. They aren't lazy. They are experiencing a systemic breakdown of operational clarity.
A clinical front of house workflow analysis reveals that "working harder" is a parasitic strategy. It's like redlining an engine whilst the brakes are seized. You're burning through staff energy, a finite fuel, without gaining any ground. This leads directly to burnout and high turnover. When the system fails to provide a clear path forward, the human element compensates with raw effort until it simply cannot anymore. If you see your team vibrating with stress but tables remain un-cleared, you've hit a structural limit, not a motivational one.
The Mechanics of Staff Paralysis
Staff paralysis is the direct result of decision fatigue. When every task carries the same weight and the sequence of operations is muddy, the brain stalls. Your team spends more time deciding what to do than actually doing it. This is why a front of house workflow analysis is vital; it identifies where the linkages between roles have snapped. The Statue Effect is a structural failure of operational clarity. It’s a diagnostic signal that your workflow has redlined and can no longer support the load you've placed upon it.
Breaking the Anchor Dependency
The most dangerous symptom of a broken workflow is the "Senior Anchor". This is the one manager or veteran server who "holds it all together". On the surface, they look like a hero. In reality, they are a structural flaw. The entire operation relies on their individual energy to function because the process itself is non-existent. If they trip, the whole machine crashes. You're running a business on personality, not mechanics. To fix this, you must move from staff instructions to mechanical certainties. If you suspect your floor is held up by a single person, you might need a Senior Anchor Quick Scan to identify the rot before the anchor snaps. You need a system that functions regardless of who is wearing the headset.
The iPad Tax and Parasitic Drag: Why More Tech Isn’t the Answer
Tech is often sold as the ultimate lubricant for service. In reality, it’s often the sand. We call this the iPad Tax. It’s the hidden cost of labour spent managing the very tools meant to reduce it. If your staff spend more time fighting with a touchscreen than engaging with a guest, your tech is a parasite, not a multiplier. A front of house workflow analysis usually reveals that "omnichannel" ordering is actually "omnichannel chaos".
Consider the "Screaming Printer". Orders flood in from DoorDash, Uber Eats, and your in-house POS. If these streams aren't perfectly synchronised, the kitchen hits a terminal bottleneck. The printer doesn't stop. The staff can't catch up. This isn't a sales success; it's a mechanical failure of the digital gearbox. You're paying for technology that actively degrades your throughput whilst increasing the mental load on your team. You’re redlining the machine without moving the needle on your ROI.
Identifying Tech Inefficiencies
Efficiency dies in the "ping-pong" effect. This is the sight of a server bouncing between four different tablets to acknowledge orders whilst a guest waits at the host stand. It’s a diagnostic signal of data silos. When your front-of-house tech doesn't talk to the back-of-house system, your staff become the manual bridge. They spend their finite energy translating digital data into physical action. During peak hours, "more features" simply mean more failure points. If a tool doesn't shave seconds off a task, it’s dragging your margins into the dirt.
Realigning the Digital Gearbox
System integration is not the same as system clutter. You don't need more apps; you need better linkages. Audit your software subscriptions based on actual operational output, not marketing promises. Ask the hard questions. Does this tool reduce the steps required to complete a transaction? Does it lower the thermal redline of the floor? If the answer is no, you’re paying a tax you can’t afford. A rigorous front of house workflow analysis focuses on tools that simplify the machine. You want a digital gearbox that handles the heavy lifting so your humans can focus on the high-stakes mechanics of hospitality. Stop buying "solutions" that create more problems.
Performing a Workflow Stress Test: A Diagnostic Framework
You cannot fix a machine if you don't know where it’s seizing. A front of house workflow analysis isn't a performance review; it’s a diagnostic stress test. Stop looking at your floor as a collection of personalities and start seeing it as a series of pressure valves and linkages. If you don't have a framework for identifying failure, you're just guessing. Guessing is expensive.
The first step is identifying your "Thermal Redline". This is the exact moment service begins to degrade. It might be the 50th cover or the third delivery order in five minutes. Once you hit this line, friction points ignite. You'll see staff doubling back to the POS terminal because they forgot a modifier, or waiting at the pass for plates that are stuck behind a bottleneck. These aren't minor inconveniences. They are mechanical failures that lead to "Communication Lag". When the host stand, floor, and kitchen aren't in sync, the signal dies. This results in an "Evaporating Margin". You are paying for labour that produces zero revenue because the system has stalled.
The 60-Second Operational Audit
To find the truth, you must be a fly on the wall. Stand in a neutral corner. Don't interfere. Don't "help". Just observe. Listen for the Screaming Printer. If it’s rattling non-stop whilst the pass is empty, your kitchen is the bottleneck. Watch for "busy work" versus "revenue work". If a server is polishing cutlery whilst a guest is trying to catch their eye for the bill, your workflow is misaligned. Busy work is a comfort zone; revenue work is what pays the rent. If your team can't tell the difference, your gearbox is stripped.
Data vs. Gut Feeling
Owner intuition is a liability. It is almost always blinded by "Senior Anchor" bias. You think the system works because your best manager is sweating blood to keep the room from exploding. That isn't a workflow; it's a hostage situation. You need objective data. Measure your "System Lag" during the busiest 15 minutes of the week. That quarter-hour tells you more about your business than the other forty hours combined. If you want to stop the bleed, you need to see the wound clearly. Take the Evaporating Margin Quick Scan to identify exactly where your profit is leaking before the next rush hits.
Realigning the Machine: The Path to Operational Clarity
Stop trying to out-hustle a broken system. You've spent months, perhaps years, attempting to fix your floor issues through sheer management effort. It hasn't worked. A front of house workflow analysis isn't about working harder; it's about achieving mechanical flow. You need to stop being the mechanic who tries to hold the engine together with his bare hands whilst it’s running at 5000 RPM. You need to shut down the noise and fix the linkages. Clarity comes from seeing the machine for what it is, not what you wish it to be.
Traditional consultants will charge you thousands to tell you what you already know. They offer generic advice that fails the moment the room gets busy. We don't do that. Our Quick Scans identify the exact shear points in your operation in 60 seconds. For €7, you get a diagnostic reality score that cuts through the ego and the excuses. It is the low-friction alternative for operators who value precision over polish. You don't need a three-month audit; you need to know which bolt is loose right now.
Fixing the Friction Points
Intervening in the Statue Effect requires more than a pep talk. You must realign your processes to ensure the path of least resistance is also the path of highest ROI. If your tech is creating an iPad Tax, strip it back. If your staff are freezing, simplify the decision tree. You are building a mechanical linkage that functions whilst you are off the floor. If the machine requires your constant presence to stay in gear, you don't have a business; you have a very stressful job. Realigning these points improves your throughput without the need to hire more expensive labour.
Your First Step to Operational Maturity
Operational maturity starts when you stop lying to yourself about why your margins are evaporating. The manual effort trap is a direct route to burnout. It’s unsustainable. It’s the reason you feel exhausted despite a full team on the floor. A diagnostic scan provides the data needed to move from chaos to clarity. It’s the difference between guessing where the leak is and seeing the hole in the pipe. It allows you to stop treating service issues as personality flaws and start fixing the structural friction that is killing your profit.
Diagnose your front-of-house friction with a €7 Quick Scan and stop letting parasitic drag kill your bottom line. Get the data. Fix the machine. Protect your margins.
Stop Redlining Your Staff and Fix the Gearbox
Your floor is a machine. If it's stalling, it isn't because your staff aren't "hustling" enough. It's because you haven't performed a rigorous front of house workflow analysis to find where the linkages are snapping. You can't fix a seized engine by shouting at the pistons. You need to identify the parasitic drag of the iPad Tax and the structural failure of the Statue Effect before they gut your margins. Personality-driven leadership is a myth; you need a system that works regardless of who is on the headset.
Stop wasting time on generic consulting fluff. You need raw data, not theories. Our no-nonsense diagnostic tools are built for battle-hardened operators who need immediate answers. In under 60 seconds, you can get a data-driven report that pinpoints exactly why your service is crashing. It's time to stop guessing and start fixing.
Identify your operational pressure points with our €7 Quick Scans.
Clear the smoke. Fix the machine. Get back to the business of making money.
Frequently Asked Questions
What is front of house workflow analysis and why is it different from a standard audit?
A workflow analysis is a diagnostic stress test of your service delivery machine. Standard audits focus on compliance and hygiene checklists. This analysis focuses on mechanical throughput. It identifies the structural friction that causes your floor to stall under load. Instead of ticking boxes, you are measuring the linkages between the floor, bar, and kitchen to find where the gearbox is seizing and killing your profit.
How do I know if my restaurant is suffering from the "Statue Effect"?
You’ll see staff standing still whilst the room is in chaos. It’s a diagnostic signal that the system has redlined. When the volume of incoming data exceeds processing capacity, the human brain stalls. If your team looks like they’re staring into the middle distance whilst printers scream, you’re witnessing a structural failure of operational clarity. They aren't lazy; they are experiencing a systemic breakdown.
Can software actually cause more operational friction in hospitality?
Poorly integrated tech creates parasitic drag. We call this the iPad Tax. If a server spends more time fighting a touchscreen than engaging with a guest, the tech is a failure. Omnichannel ordering often results in a "Screaming Printer" in the kitchen. This creates a terminal bottleneck where disparate data streams collide, forcing staff to act as manual bridges between disconnected systems. It’s a mechanical mess.
Why do my staff seem to freeze during peak hours even with a clear SOP?
SOPs often fail because they are too theoretical for high-pressure environments. When the gearbox shears, instructions don't stick. Clear documentation doesn't matter if the physical linkages between roles are broken. Decision fatigue sets in when the path of least resistance isn't obvious. Your staff freeze because the system provides too many choices and not enough mechanical certainty. They don't know which fire to kick first.
What are the most common points of "evaporating margins" in front of house?
Margin loss happens in the gaps between actions. It’s the server doubling back to the POS because of a clunky interface. It’s the manager acting as a "Senior Anchor" because the process can't function without them. These inefficiencies represent labour costs that produce zero revenue. Every second of system lag is a direct hit to your bottom line. You are paying for effort that doesn't move the needle.
How can I perform a workflow analysis without hiring an expensive consultant?
Use data-driven diagnostic tools designed for rapid intervention. You don't need a three-month audit to find a loose bolt. A front of house workflow analysis can be conducted using targeted 60-second scans that identify specific failure points. These tools provide an objective reality score of your business. You get the data you need to fix the machine without the generic management fluff or the corporate price tag.
What is the "iPad Tax" and how does it affect my bottom line?
The iPad Tax is the hidden cost of labour required to manage inefficient technology. It’s the friction caused by staff acting as manual translators between disconnected software silos. This parasitic drag eats your profit by bloating labour hours for tasks that should be automated. If your tech stack doesn't simplify the machine, it’s a financial liability. It erodes your ROI whilst increasing the mental load on your team.
How long does a typical operational diagnostic take to show results?
A 60-second Quick Scan provides immediate data-driven reports. You don't have time to wait weeks for a consultant's report whilst your margins bleed. These assessments identify the "thermal redline" of your service instantly. Once you have the diagnostic reality, you can implement mechanical interventions immediately. You can stop the crash and realign your floor for better throughput before the next Saturday night rush hits.


